The recent jobs slump: a canary in the coal mine or bats in the belfry?
The National numbers
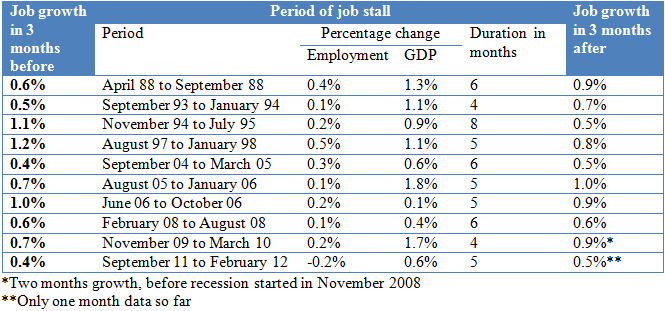
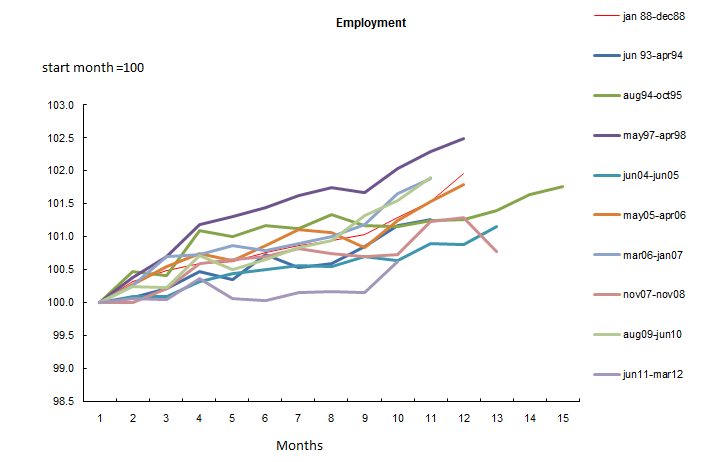
At the national level, the pattern of a stall in growth for an extended period of time lasting at least four months, bracketed at both ends by strong gains in employment, happens on a regular basis. This pattern began to occur in the LFS in 1988, and in the next 24 years has happened 10 times, or on average nearly every two years (if you exclude recession years, the recurrence is even more regular). The table below sets out the ten periods of little or no growth in employment, and job growth in the three months before and after these pauses, as well as what GDP did while employment was slowing.
Of the 10 episodes, three saw growth stall for 4 months, another four paused for 5 months (including the one just ended), two were 6 months long, and one was 8 months in duration. Growth in the three months before and the three months after these episodes both averaged a robust 0.7%.[i]
Analysts are going to have to get used to dealing with these extended pauses in an otherwise healthy economy, to judge by their increasing frequency over time. Only one of these periods occurred in the 1980s; three happened in the 1990s, and six have occurred in the past decade.

One of the most salient features of these periods of little or no growth in jobs is that GDP growth usually continues at a rapid clip. While jobs on average rose only 0.2% during the ten episodes, GDP growth during these same periods averaged a solid 1.0%. Indeed, there is only one occasion when GDP growth slows to the same pace as jobs (that was in 2006). The latest example in 2011-2012 is typical; while jobs slipped 0.2% over a five month period, GDP rose 0.6%, and possibly more once data for February become available.
It is interesting to speculate why these extended periods of little or no job growth, mostly unrelated to the ebb and flow of the underlying business cycle, are occurring more frequently. One reason is that the economy itself is more oriented to both natural resources and construction, which statistically are more volatile than the average[ii].

There also appears to be a seasonal component to these periods of no job growth. Of the 10 episodes since 1988, seven occurred during the autumn and winter months (including the current one) and only three in spring and summer. This is somewhat unexpected, as the trend to milder winters and improved techniques to keep working in winter weather (notably in construction) should have given a boost to working during this time of year. It may be that this impact is more than offset by the growing share of people working in natural resources and construction. While their seasonal volatility in these industries has been diminishing, they remain more seasonal than the parts of the economy they are replacing (such as manufacturing), which would increase overall volatility in the economy.
So the clear conclusion is that in 9 out of 10 episodes outside of recessions, jobs can stall for periods of up to half a year without it being related to the business cycle. Pauses in job growth for extended periods of time are not “canaries in the coal mine” signalling impending weakness in GDP, but “bats in the belfry” for analysts who believe they signal anything other than the large amount of noise in the monthly survey of jobs, unless the slowdown is validated by GDP.
The industry and provincial detail
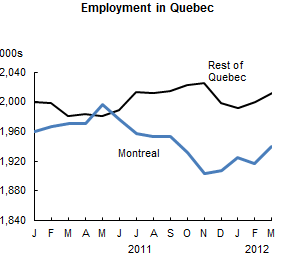
This is where most of the concern about the volatility of the recent jobs data should be centred. As we have just seen, the volatility at the national level is a recurrent theme, and seems to be related to structural and seasonal shifts in the Canadian economy. The most intriguing movement in provincial employment was in Quebec, where jobs fell by 1.4% between July and December before recovering by 0.9% in the first quarter of 2012. We analyzed this province’s labour market in detail in the first edition of Just the Facts.
Some analysts have theorized that the quixotic behaviour in Quebec is related to the underground economy and the hike in the HST on January 1, 2012. This does not stand up under closer examination. The most pronounced weakness in Quebec’s employment was in the fourth quarter, before the HST was raised. Moreover, the largest drop in jobs was in manufacturing, a sector that actually benefits from the HST, which is imposed only on final purchases (such as retailers). Meanwhile, sectors such as retail sales which are subject to the HST posted strong gains in the fourth quarter. Then, in the first quarter of 2012, after the HST hike, employment rebounded in Quebec, even as retail sales and retail employment slumped. People who think the black market and the HST explain the recent behaviour of employment in Quebec simply know nothing about economics or statistics.

A last objection to this theory is that it does not explain why all of the job loss was confined to Montreal: was the HST only imposed in Montreal and not the rest of Quebec? Whatever theory is advanced has to explain the regional pattern of jobs in Quebec late in 2011. For whatever reason, employment in Montreal plunged by 50,000 between July[iii] and December, but rose by 33,000 in the first three months of the year. The recovery so far this year actually contradicts several high-profile, but overall small, closings in the Montreal region.[iv] Meanwhile, employment in the rest of Quebec was remarkably stable over this period.[v] In fact, its pattern of small gains late in 2011 and then a dip early in the new year fits what one would expect from the hike in the HST. But the real crux of the problem is the contradiction between weak employment data in Quebec and gains in retail sales and overall GDP, estimated by the provincial statistical agency to be up 0.9% in the fourth quarter.
[i] These periods differ slightly from those used in a previous paper I wrote on periods of slowdown, which looked at simultaneous decelerations in both GDP and employment. P. Cross, “Slowdowns during periods of economic growth”. In the Canadian Economic Observer, December 2010.
[ii] See P. Cross, “Are monthly changes in the economy becoming more volatile?” In the Canadian Economic Observer, January 2009.
[iii] There was an overall decline of 93,000 jobs in Montreal from its peak in May, but I am discounting this as just a one-month spike due to noise in the survey, as one can see in the graph.
[iv] These include closures by Electrolux AB, Johnson & Johnson and Sanofi. See “After cruising through slump, Quebec’s jobless rate soars” in Globe and Mail, January 13, 2012.
[v] The data for Montreal are seasonally adjusted, and then a 3-month moving average is applied to smooth out this series. I calculate the data for the rest of Quebec by subtracting the seasonally adjusted employment for Montreal from the seasonally adjusted estimates for all of Quebec. The results are remarkably stable, and show no residual seasonality.

